

The website will be offline from Wednesday the 27th of May 2026 at 8:00 AM to Wednesday the 27th of May 2026 at 12:00 PM. We apologize for any inconvenience this may cause.
The challenges of mapping oil wells in the Delaware Basin
Each year LANDFIRE (LF) Annual Disturbance (Dist) products depict where changes have occurred on the landscape, both spatially and temporally. The Dist products inform model vegetation transitions to provide updates to LF vegetation, fuel, and fire regime products. While LF is known for mapping fires, clearcutting, and harvests, sometimes unusual disturbances are mapped. Oil wells in New Mexico and Texas are one such unusual disturbance for analysts to map. These areas are mapped in the LF Dist product due to the removal of shrubland and grassland from the landscape. The below example demonstrates one of these oil well mapping efforts.
Located in west Texas and southeast New Mexico is the Permian Basin. The Permian Basin is a large sedimentary basin distinguished by its rich petroleum, natural gas, and potassium deposits. Due to its economic importance, it is one of the most well-studied geologic regions of the world. The Permian Basin is made up of three component parts: the eastern Midland Basin, the Central Basin Platform, and the western Delaware Basin. For this example, we will be focusing on the western Delaware Basin (outlined in bright yellow).
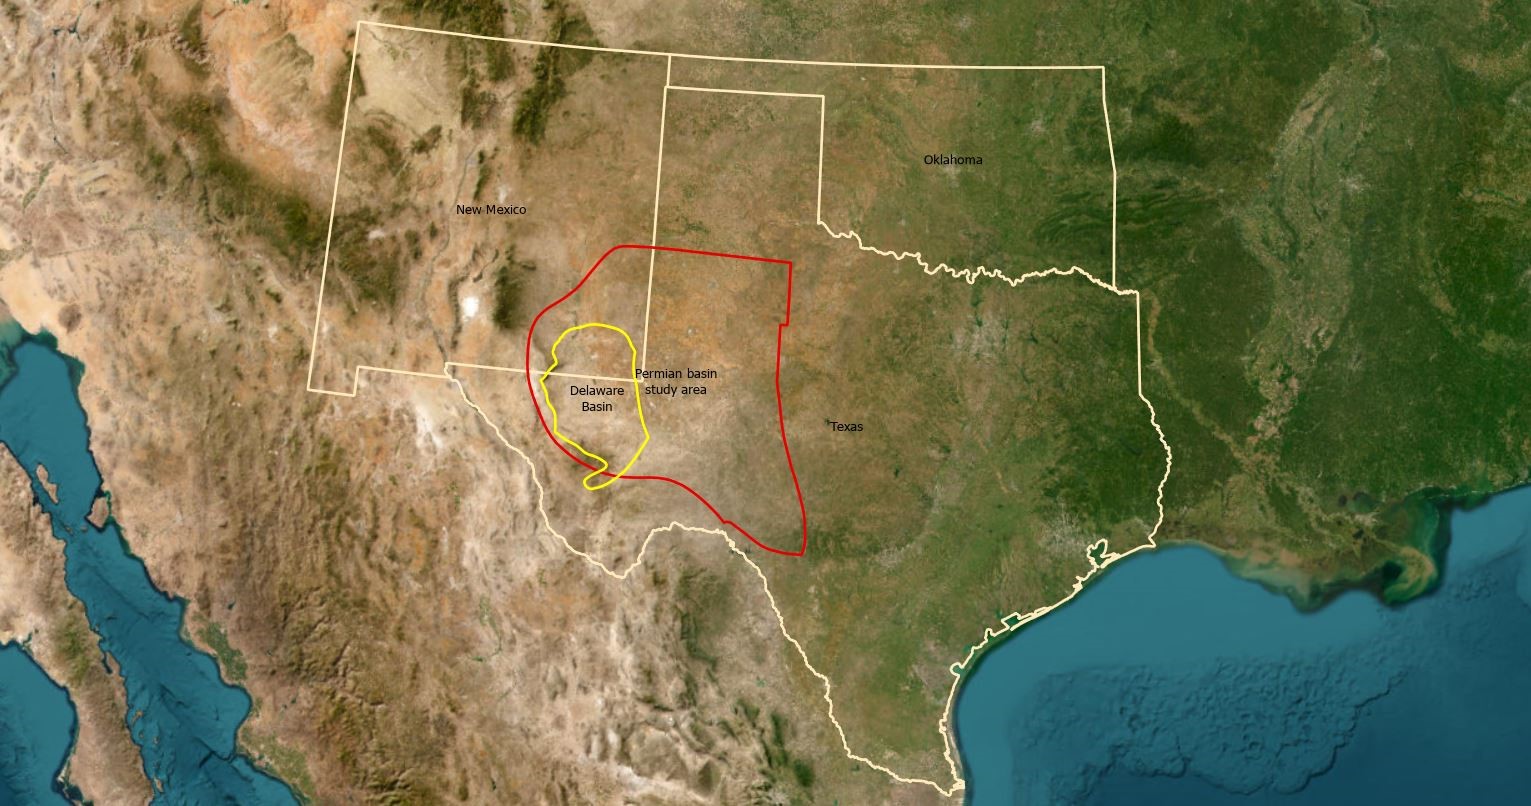
The Delaware Basin covers an extensive area of approximately 10,000 square miles. It spans across several counties in Texas and New Mexico. Its prominence in the Permian Basin has made it a crucial player in the energy sector, attracting substantial investment and attention from the oil and gas industry.
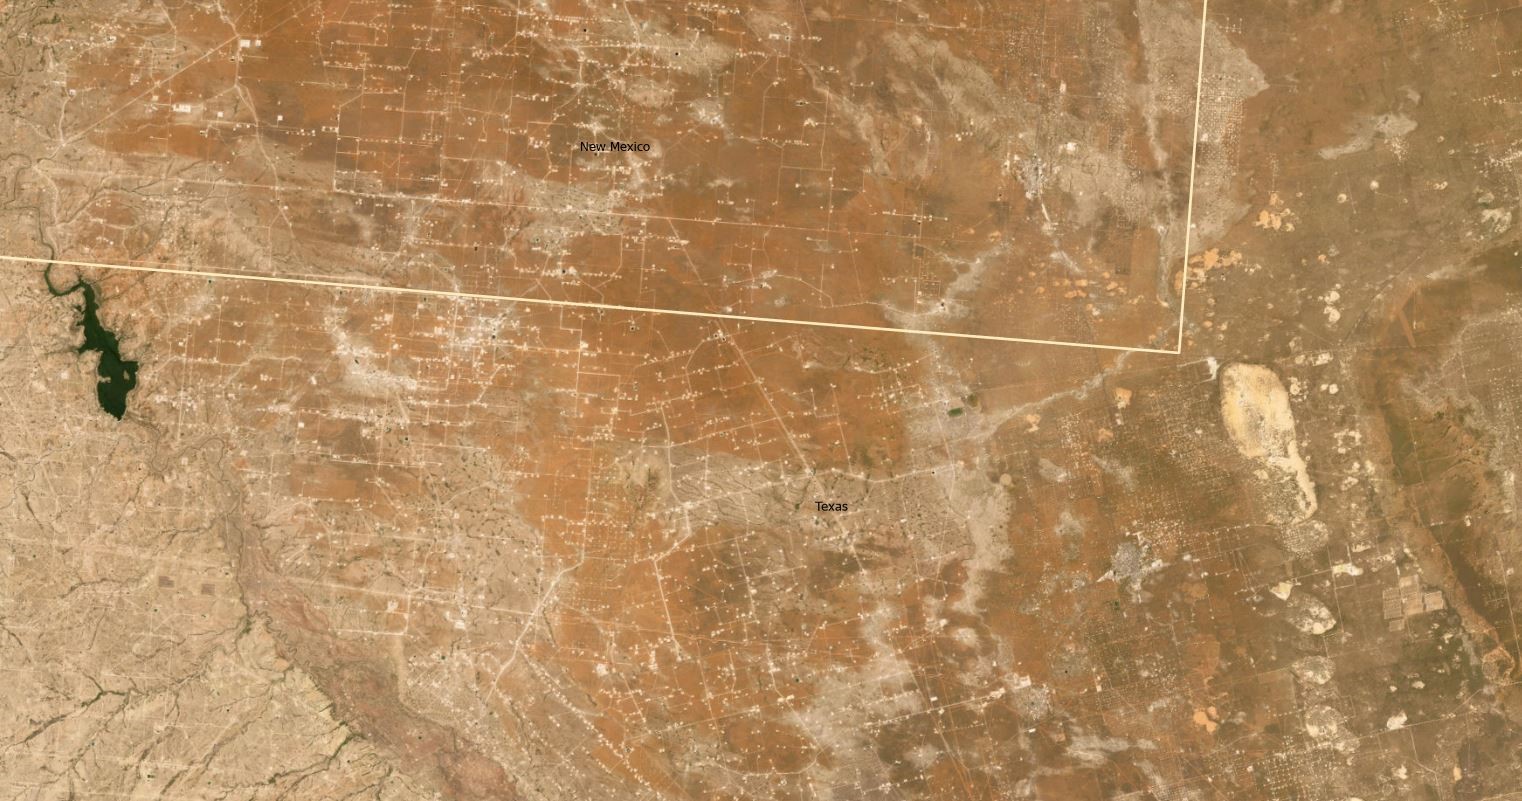
The below image is located within the Delaware Basin east of the Red Bluff Reservoir. The white lines and dots are access roads, pipelines, and oil wells. They are in abundance due to the rich oil reserves of the Delaware Basin, which can make it difficult for LF analysts to find changes to the landscape in those areas.
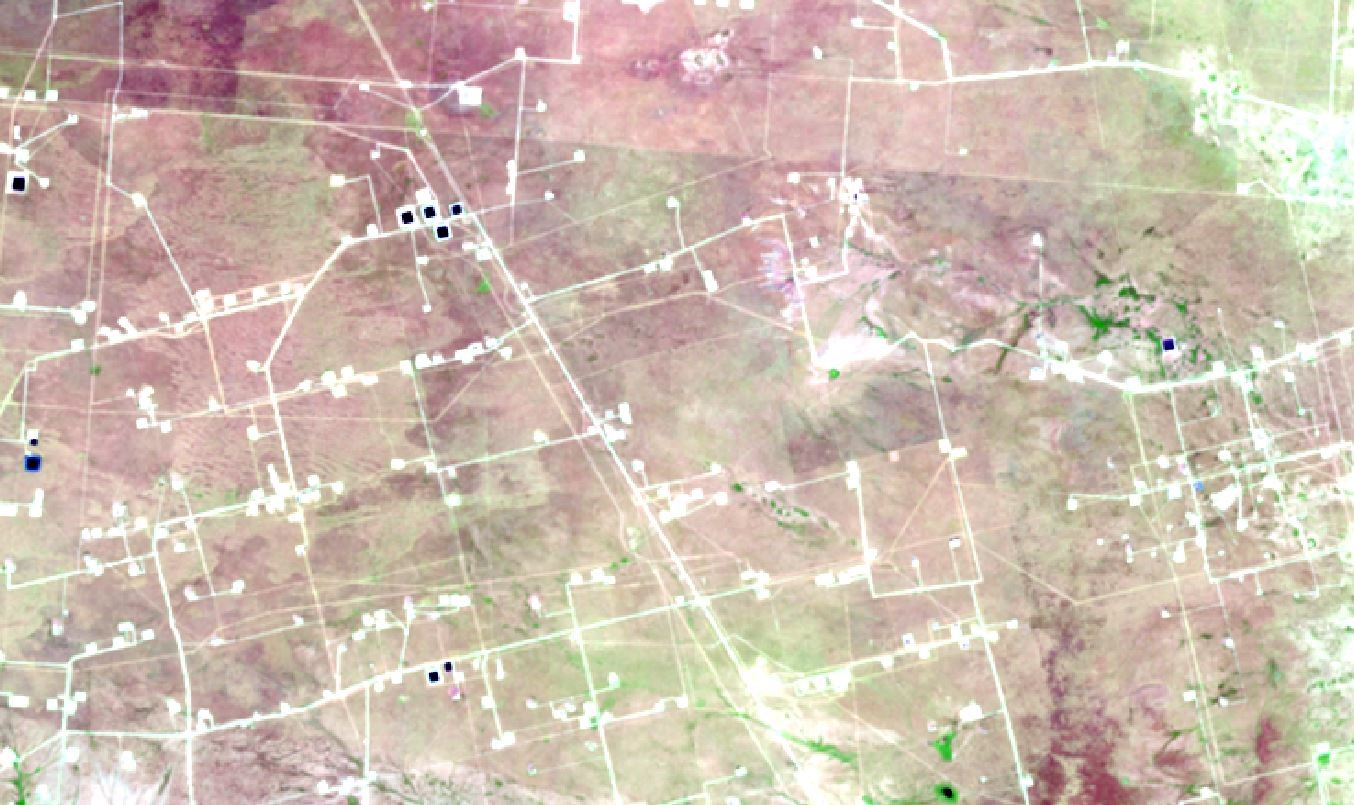
Below is a closer look of the same area within the Delaware Basin. This 2022 image (left) more clearly shows oil pads, access roads, and pipelines (seen in white). Then the 2023 image (right) captures the same area with increased oil pads in the following year. Can you spot the changes and additions? Our analysts spend many hours finding those differences from year to year! If you look closely, you can see that more oil pads, roads, and pipelines have been added.
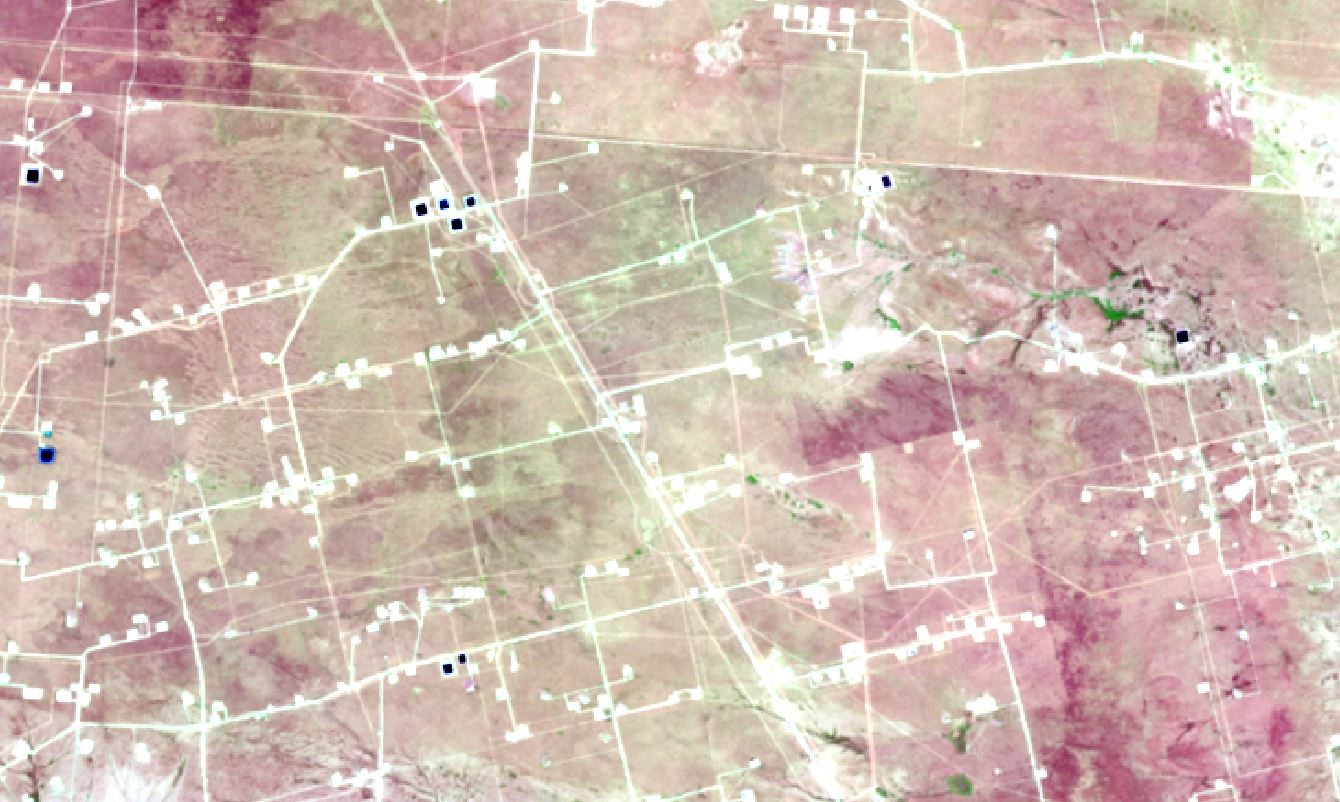
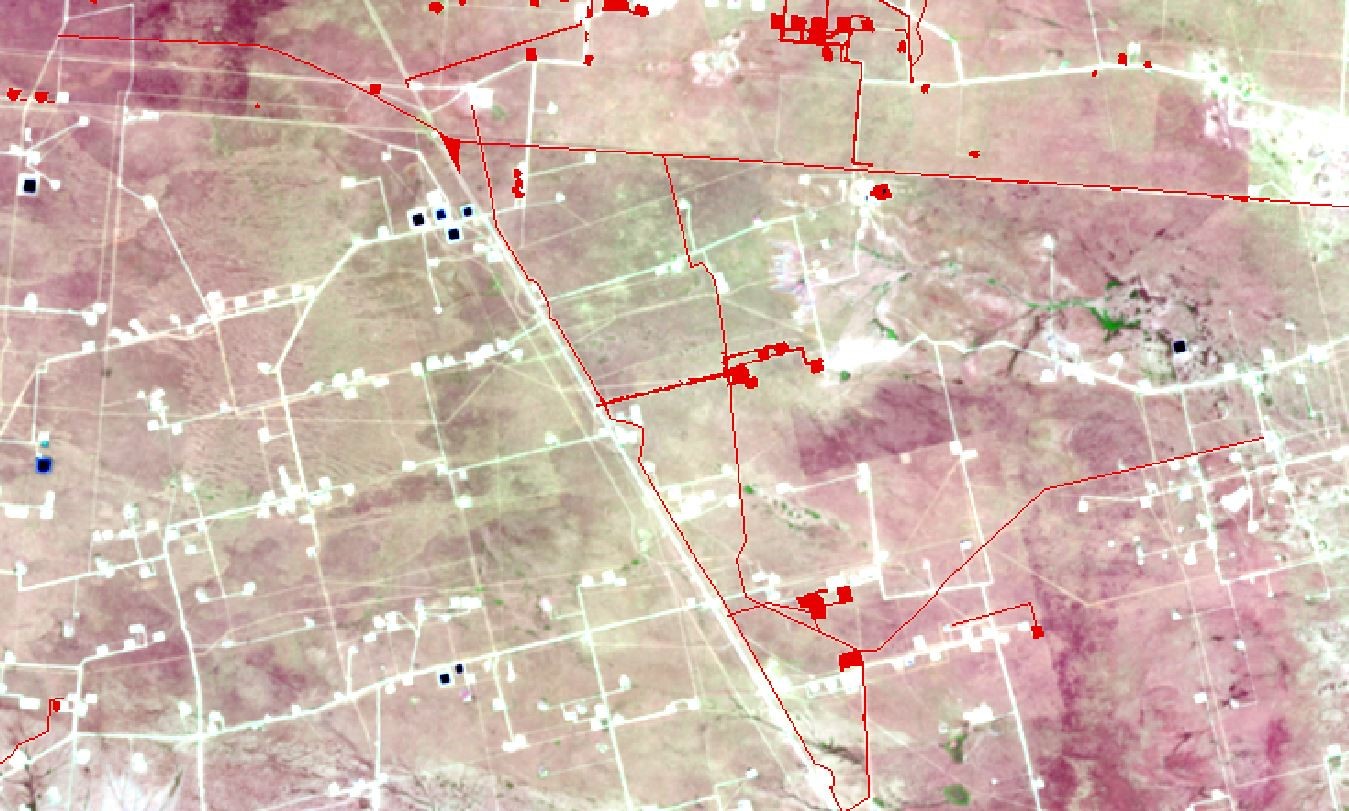
Below is that same 2023 image but LF analysts have identified the new oil pads, roads, and pipelines for you. The red shows raster data where the disturbances were mapped, which are captured in the Dist23 product featured in the LF 2023 Update for the Conterminous United States.
Product Description
Percent Fire Severity (PFS) is three products merged into one. It is a combination product of what was previously (LF 2014 and earlier) known as Percent of Low-severity Fire (PRC_SURFAC), Percent of Mixed-severity Fire (PRC_MIXED), and Percent of Replacement-severity Fire (PRC_REPLAC). Low severity is defined as less than 25 percent average top-kill within a typical fire perimeter for a given vegetation type. Mixed severity is defined as between 25 and 75 percent average top-kill within a typical fire perimeter for a given vegetation type. Replacement severity is defined as greater than 75 percent average top-kill within a typical fire perimeter for a given vegetation type.
At the release of LF 2016 Remap Percent of Low-severity Fire, Percent of Mixed-severity Fire, and Percent of Replacement-severity Fire were included as attributes in the Biophysical Settings (BPS) product. In calendar year 2024, these 3 products were merged into a single product called Percent Fire Severity (PFS).
Percent Fire Severity Resources
LF 2016 Attribute Data Table (CSV)
LF 2023 Attribute Data Table (CSV) - AK Only
LF 2016 Attribute Data Dictionary (ADD)
LF 2023 Attribtue Data Table (ADD) - AK Only
LF 2016 Attribute Data Table (CSV)
LF 2023 Attribute Data Table (CSV) - AK Only
LF 2016 Attribute Data Dictionary (ADD)
LF 2023 Attribtue Data Table (ADD) - AK Only
LF Definitions, Quality, and Standards - provides information about contributors, metadata and data standards, data creation, and data testing. This document also provides details about our general data release process.
LF Dictionary - a “one-stop shop” general resource that provides information about products, Attribute Data Dictionaries (ADDs), data and metadata, and terms.
LF Version Comparison Table - view the version history for each individual product.
LF Naming Conventions - understanding the version number
The Historical Fire Frequency and Severity products listed below represent fire regimes prior to European colonization, which are the outputs of locally developed state-and-transition models. Using those historical products as the reference condition, LANDFIRE developed Vegetation Departure products that estimate current vegetation conditions.
We are Listening to Feedback
For the release of LF 2016 Remap, Historic Fire Regime products were nested within the Biophysical Settings (BPS) product as attributes. Then, in calendar year 2024, Fire Regime products became stand-alone products once again.
Historic Fire regime products are used:
- for landscape assessments
- in comparisons of historical to current conditions
- to identify landscape management priorities